+
Действующая цена700 499 руб.
Товаров:37
На сумму: 18.463 руб.

Электронная библиотека диссертаций

Доставка любой диссертации в формате PDF и WORD за 499 руб. на e-mail - 20 мин. 800 000 наименований диссертаций и авторефератов. Все авторефераты диссертаций - БЕСПЛАТНО

Расширенный поиск

Принципы формирования и применения ультракоротких зондирующих импульсов в акустической микроскопии
  • Автор:

    Дин Цзиньвэнь

  • Шифр специальности:

    01.04.01

  • Научная степень:

    Кандидатская

  • Год защиты:

    2010

  • Место защиты:

    Москва

  • Количество страниц:

    128 с. : ил.

  • Стоимость:

    700 р.

    499 руб.

до окончания действия скидки
00
00
00
00
+
Наш сайт выгодно отличается тем что при покупке, кроме PDF версии Вы в подарок получаете работу преобразованную в WORD - документ и это предоставляет качественно другие возможности при работе с документом
Страницы оглавления работы
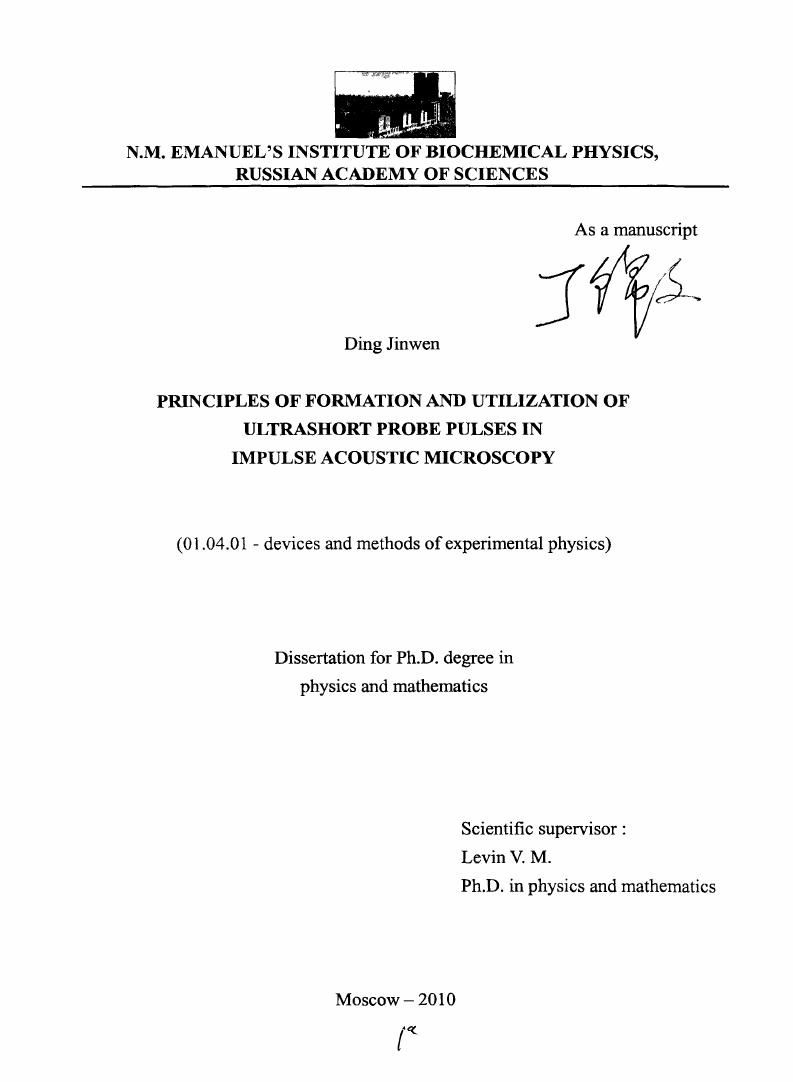
N.M. EMANUEL’S INSTITUTE OF BIOCHEMICAL PHYSICS, RUSSIAN ACADEMY OF SCIENCES
As a manuscript
Ding Jinwen
PRINCIPLES OF FORMATION AND UTILIZATION OF ULTRASHORT PROBE PULSES IN IMPULSE ACOUSTIC MICROSCOPY
(01.04.01 - devices and methods of experimental physics)
Dissertation for Ph.D. degree in physics and mathematics
Scientific supervisor:
Levin V. M.
Ph.D. in physics and mathematics
Moscow-2010
TO ALL DEVOTED RELATIVE OF MINE!
AND ESPECIALLY IT IS FOR MY DEAR SON - DING HAN!
CONTENT
INTRODUCTION
Chapter 1. IMPULSE ACOUSTIC MICROSCOPY - FUNDAMENTALS AND BASIC
PRINCIPLES OF APPLICATION
§1.1. High-resolution acoustic vision systems
§ 1.2. Principles of focused beam formation
§1.3. Interaction of convergent ultrasonic beams with the liquid-solid interface
§ 1.4. Survey of present-day acoustic microscopy
§ 1.5. Experimental installation and exploited methods
Chapter 2: EXPERIMENTAL ANALYSIS ON THE FORMATION OF ULTRASHORT
PULSES BY ACOUSTIC LENS
§ 2.1. Electrical excitation along the thickness extensional mode of transducer
§2.2. Experimental investigation on the transducer response to the shock excitation
2.2.1. Shock excitation of short probe generator and the transducer response
2.2.2. Evaluating piezoelectric transducer resonance response of acoustic lens
2.2.3. Experimental evaluation and improvement for the quality of ultrashort pulse with the backing
matching
§ 2.3. Frequency evaluation of ultrashort probe (acoustic interaction between the plane disk-shaped
transducer and spherical cavity) of acoustic lens
§2.4. Experimental investigation of acoustic signal formation and acoustic interaction inside
waveguide
2.4.1. Experimental investigation of acoustic echo signal formation from acoustic interaction
between transducer and spherical cavity of acoustic lens waveguide
2.4.2. Evaluation of the echo signal formation from acoustic interaction between transducer and side
wall of waveguide cylindrical rod
2.4.3. Conclusion of fixed parasitical echo along the t axis for impulse acoustic microscope
Chapter 3: PRINCIPLE AND EXPERIMENTAL INVESTIGATION OF INTERACTIONS
BETWEEN ACOUSTIC LENS AND PLANE OBJECT BY ULTRASHORT PULSE
§ 3.1. Acoustic interactions of ultrashort focused beam with the front surface of
plane object in immersion
3.1.1. Experimental investigation of ultrashort pulse interaction with the front surface of
plane object
3.1.2. Experimental evaluation about the paraxial focused beam of ultrashort pulse
3.1.3. Evaluation about the effect of geometric focus
§ 3.2. Acoustic interaction with the bottom of parallel plane object by ultrashort pulse
3.2.1. Investigation of wave interaction model with plane object
3.2.2. Formation investigation of the longitudinal wave reflection from the bottom of
parallel plane object
8 us; 16jj.s; at any position inside the basic pulse repetition time of lOOps. Each echo pattern (O-scan) can be saved as a graphical file or in digital form as a data file. Sampling frequency of the employed ADC is 200M/s, so accuracy of time delay measuring is 5 ns. Resolution of individual pulses in echo patterns depends on operation frequency of the microscope - it can be estimated as a width of the single probe pulse. Time delay can be measured graphically with two line markers at the PC display or calculated from the corresponding data file.
O-scans are the started kind of data representation. An O-scan provides choice of a position and width of a time interval (electronic gate) within which signal data will be employed to form an acoustic image. The choice is performed using special line markers inside the O-scan window in the PC display screen. Magnitude of the echo signal chosen for imaging is fit by changing signal gain level from in the range ofO-50 dB.
Acoustic images (B- and C-scans) are produced by ID or 2D scanning of the acoustic objective. Linear scanning gives a B-scan. B-scan is formed as a sweeping trace for a part of the recorded signal within limits established by the electronic gate in the corresponding O-scan. Usually B-scans are a sets of bright lines produced by positive and negative peaks within the electronic gate; these lines are separated by dark spaces corresponding to delay times for which reflected echo pulses are lacking. Respectively, one axis of the B-scan gives the current coordinate of the observation point along the scanning line; the other indicates delay time of the received impulse. The time is proportional to a depth of the obstacle location. Thus, B-scans display object microstructure in a transverse section of the object bulk along the line of scanning.
C scans result from grey-scale displaying an echo-signal characteristic value, usually maximal magnitude within a chosen electronic gate, while 2D scanning the acoustic objective over the prescribed area in the specimen surface. Parameters of scanning - position and width of the electronic gate, have been preliminarily set in the O-scan. They prescribe depth of a layer to be displayed within the specimen bulk and thickness of the layer. The minimal thickness of the layer is preset by the minimal available width 10 ns of the electronic gate. Real spatial thickness of the displayed layer depends on elastic wave velocity in an object; usually it is a few tens of microns.
A successive sequence C-scans realized at diverse depth inside the specimen bulk displays layer-by-layer changes in object microstructure. Such serial sets of images make it possible to recover 3D microstructure inside the bulk of objects (microtomogrphic regime).
A part of experimental work concerning probe beam formation by the piezoelectric transducer has been done with the digital oscilloscope Tektronix-TDS 3032B. The oscilloscope operates at frequencies up to 300 MHz with the sampling rate of 2.5G/s.

Рекомендуемые диссертации данного раздела

Время генерации: 0.212, запросов: 1558